It is common to encounter situations, where one has
- data from the same assay from different labs or sources, or
- data from different assays all targeting a phenomenon.
One then proceeds to test a desired hypothesis on the basis of these multiple datasets. The only challenge in doing this is the manner in which the different datasets can be combined in a statistically appropriate way. Since in the biological context, it is rather difficult to quantify the quality of different datasets. It is common practice to perform the hypothesis test on the different data individually and then combine the resulting p-values and occasionally the test statistics. The approaches are broadly termed meta-analysis.
These approaches do not however cover the situation where two different approaches are used to test the same hypothesis on a single dataset. One might hope to improve power by using different (complementary?) approaches. Suppose we have measurements of 2000 features across two different conditions. For simplicity, we assume the measurements are normally distributed under both conditions and we have 5 replicates for each feature-condition combination.
The t-test is the appropriate test for the difference between two means. Since we have but 5 replicates for each conditions in general, we might opt for a non-parametric Wilcoxson rank-sum test that does not assume normality of the data. In order to be ‘sure’, we run both these tests and then combine the p-values using the package MetaDE that implements five different meta-analysis procedures for combining p-values.
A simple approach to test the validity of such meta analysis approaches to this situation is to look at the distribution of the p-values under the null hypothesis – p-values under the null hypothesis are uniformly distributed in [0,1] if test-statistic takes continuous values. Hence, performing this meta-analyses should indeed leave the p-values uniformly distributed if the data are generated under the null hypothesis.
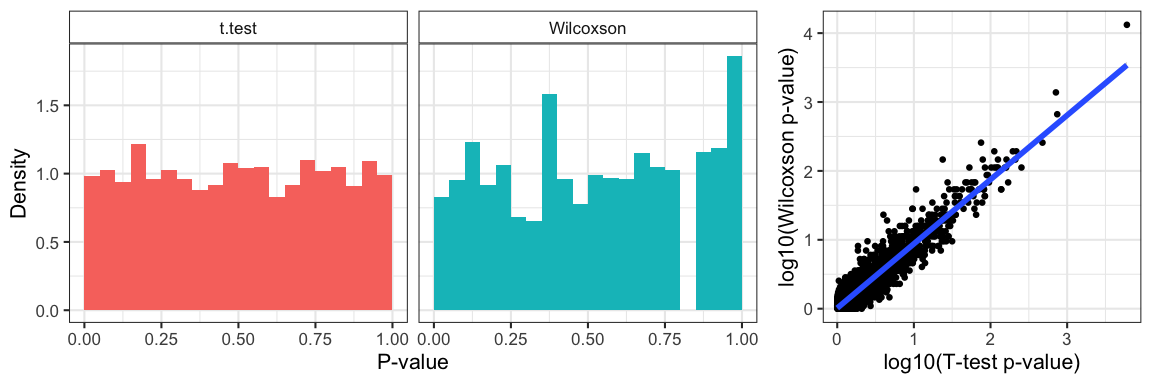
Figure 1: P-value distribution of the null-distribution data under both tests and the correlation between the p-values from the two methods.
Since we generated all our data under the null-distribution, we notice that p-values are uniform under the t-test but not the Wilcoxson; the latter is a discrete distribution with discrete-valued test statistic (the rank-sum). Not surprisingly, since we applied both methods to the same data, we obtain highly correlated p-values from both tests (pearson correlation=0.8831468).
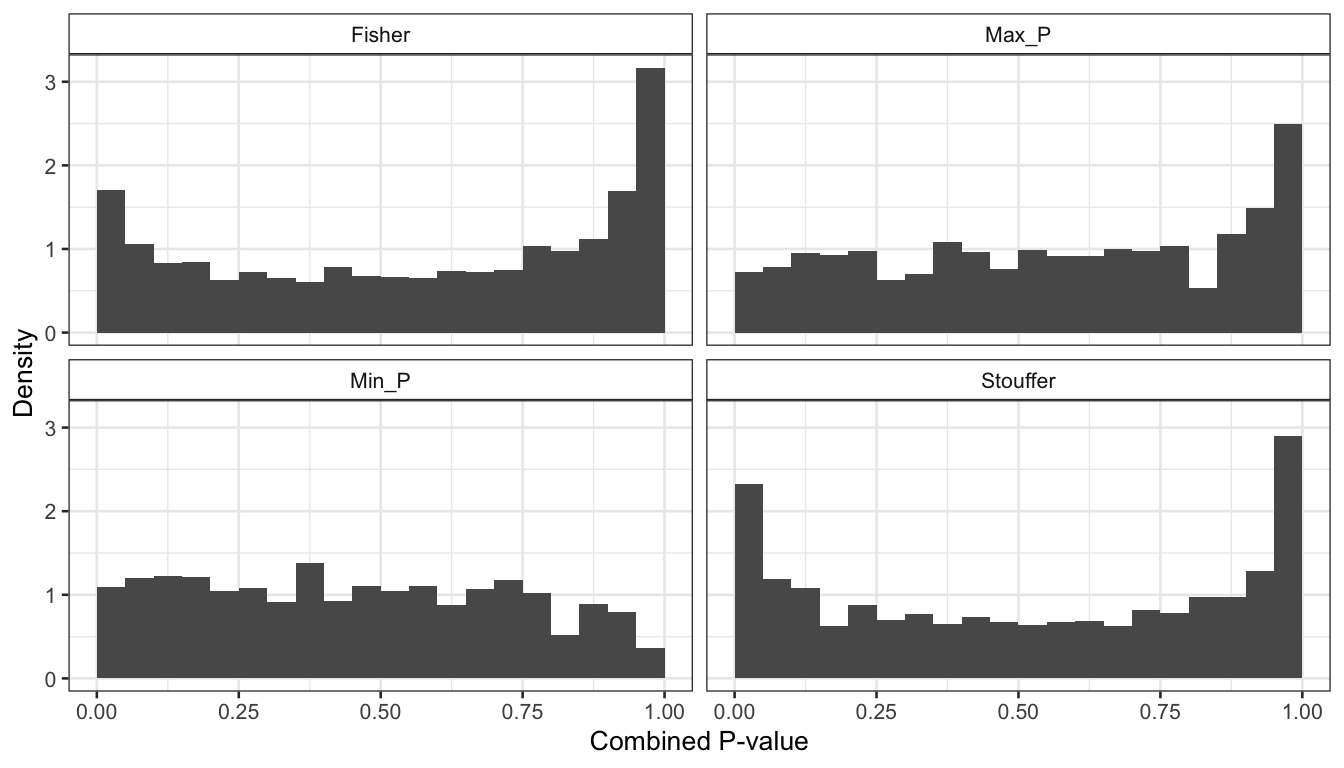
Figure 2: P-values distribution of the combined meta-analysis p-values.
Interestingly, it is clear that none of the methods produce a distribution that is uniform. The Fisher and min-P methods produce conservative estimates of the p-values (p-values under the null-hypothesis are shifted towards 1), while the Stouffer and maxP produce anti-conservative (optimistic) p-value estimates.
Another perspective on the same data can be obtained by looking at if do control Type I errors at the level we want to. If we control at a level (\alpha), then expect that (P(p<\alpha)=\alpha,~\textrm{ under }H_0.)
| Method | α<0.01 | α<0.05 | α<0.1 |
|---|---|---|---|
| Fisher | 0.03 | 0.09 | 0.14 |
| Max_P | 0.01 | 0.04 | 0.08 |
| Min_P | 0.01 | 0.05 | 0.11 |
| Stouffer | 0.04 | 0.12 | 0.18 |
It is clear from the above table that the conservative methods control Type I errors (false positives) more strigently than the the anti-conservative methods over a variety of levels.
Effect of p-value correlations
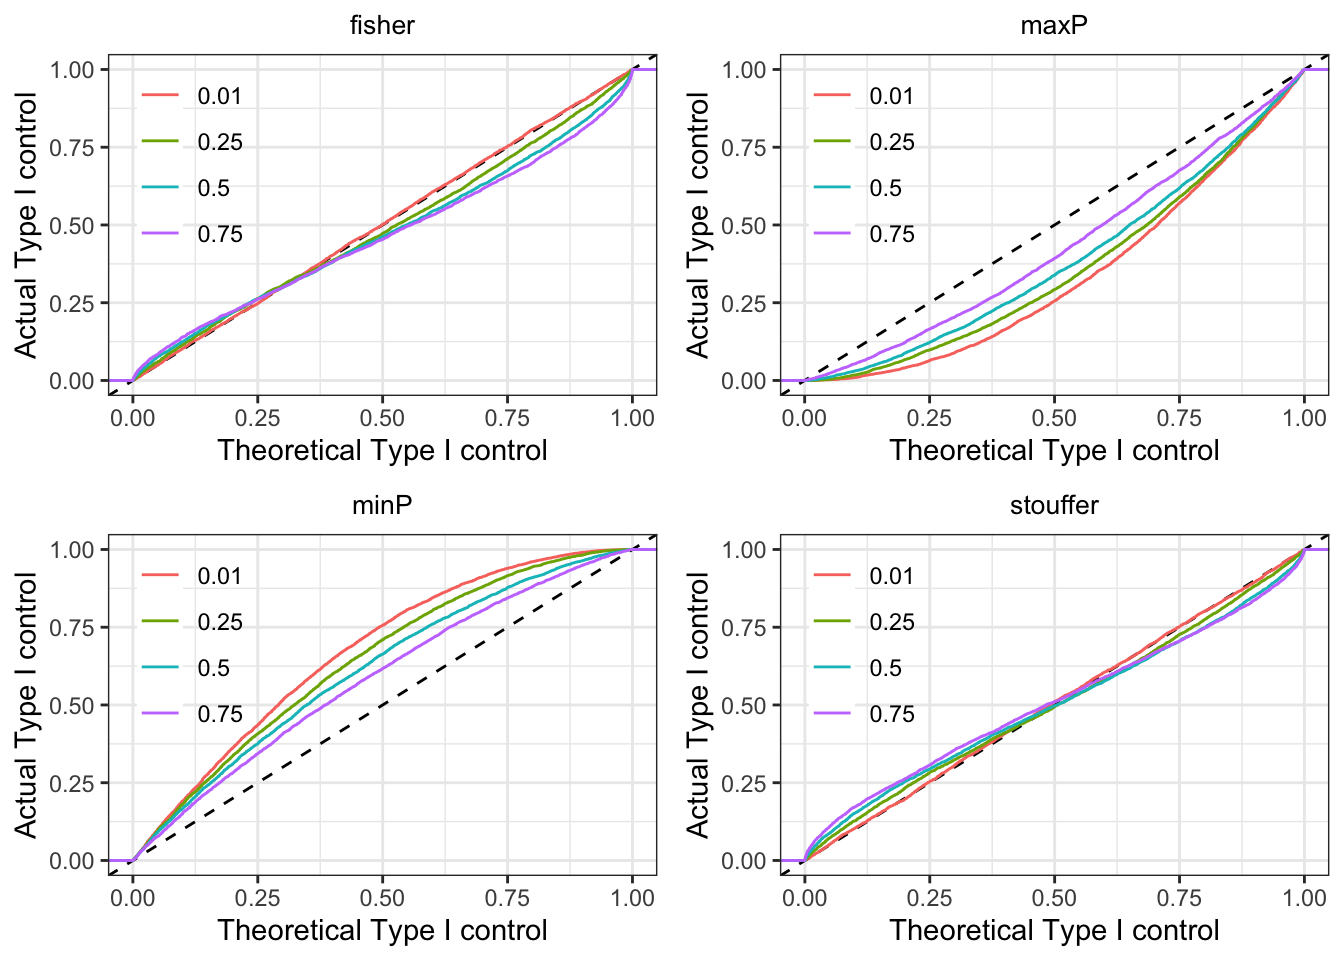
We generated approximately uniform p-values from two hypothetical tests. We allowed correlations between the p-values to simulate the effect of tests performed on the same data as in the previous section. If the p-value combining worked correctly, we would expect the theoretical and actual Type I control is match (along (y=x)).
We see our conclusions on the four methods bear out. minP is anti-conservative and Stouffer and maxP are conservative. Fisher anti-conservative for low (practically useful) thresholds but anti-conservative at larger thresholds. The skew away from the uniform distribution for the combined p-values increases with increasing correlation. Overall, Fisher appears to be the best (of the worse) choices.