Disclaimer: I am not an immunologist nor an epidemiologist. What I do know something about is time series analysis.
Background
At home under quarantine/lockdown/shutter-in-place rules, I like many cannot but help read the news about COVID-19. I have been disconcerted by the daily vassilation in the news, for example, of whether the growth in the number of cases in Italy and Spain have stabilized. Since we live in the age of data, I decided to quantify the time it takes to double the number of infected individuals in different countries.
Most epidemiological models characterize the exponential growth of the number of infected individuals. I used data from the European Centre for Disease Prevention and Control that represents daily totals.
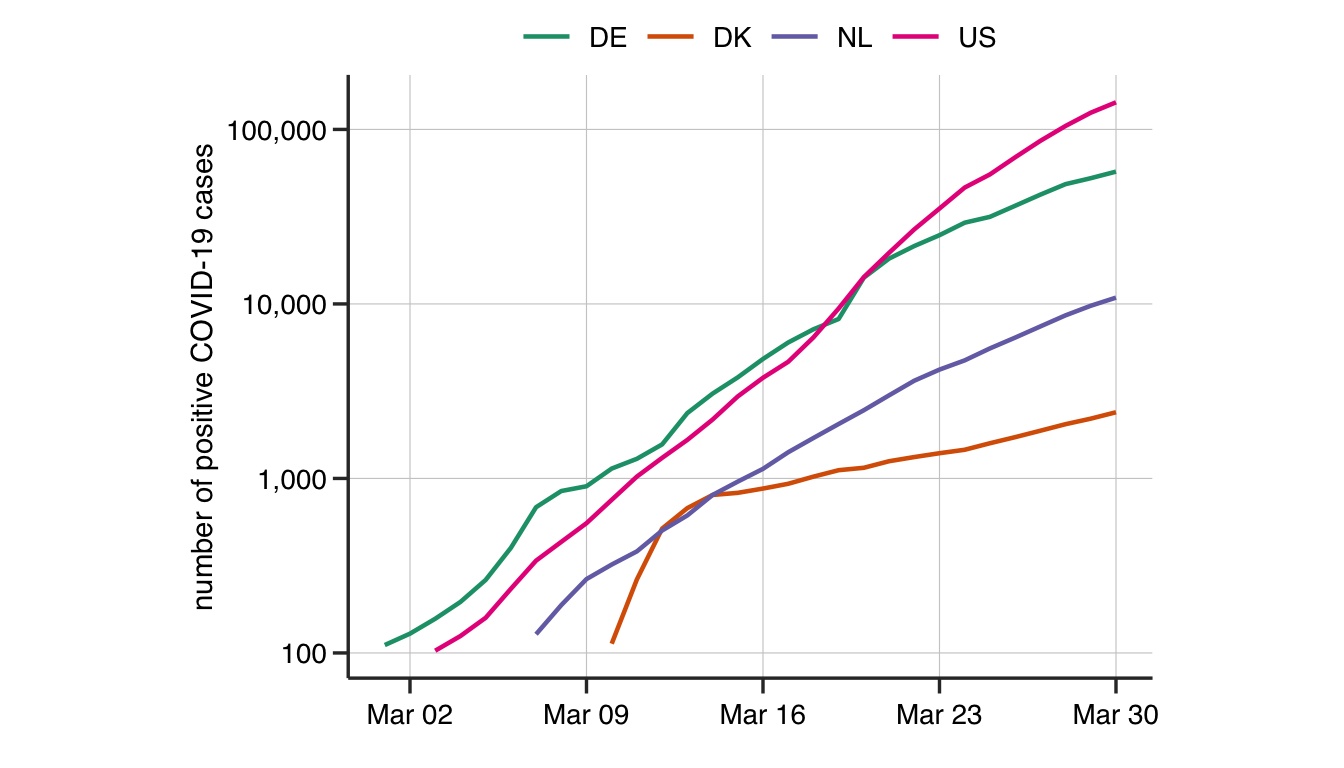
Take a look at the number of infected individuals in Germany (DE), USA (US), Denmark (DK) and the Netherlands (NL).
Method
If the number of positive cases of COVID-19 is \(N_t\), the number of infected individuals on the next day \(N_{t+1}\) is \[N_{t+1} = \alpha~N_t,\] if the growth is indeed exponential. Of course, the growth rate is never exactly exponential and its stochastic nature can be accounted for as \[N_{t+1} = \alpha~\xi_t~N_t.\]
This is equivalent to \[\log N_{t+1} - \log N_t = \log \alpha + \epsilon_t.\]
The doubling time \(\frac{\log 2}{\log \alpha}\) is estimated using lm() function in the stats package on the log-transformed count data – this assumes that the noise is \(\epsilon_t\) is uncorrelated across time and has a constant variance, which is quite a strong assumption. We only keep models that are statistically significant fits to the data.
Inclusion criteria: Only countries with at least 100 total cases of COVID-19 were included and only the time period of more than 100 cases was analyzed. For China, I used only the exponential phase of the increase until Feb 16. Moreover, I required at least 10 time points to include a country to include in the analysis. Data was downloaded on 31/03/2020 at 13:00 CET.
Results
We see that doubling times are clustered around 2-3 days in most of the developed world (Figure 1). There is a trend towards longer doubling times (slower growth) in the smaller countries. Surprisingly, Turkey has a very high rate of infection spread, while Japan, though quite large, has been very good at controlling the growth (noted elsewhere). In my original twitter post,Annoyed at imprecise claims about the increase in cases, I decided to do some simple analysis myself. Doubling time in dev. world indeed ~ 2-3 days; times increase with population (!), some surprises - Turkey, Denmark & Japan. #COVID19 #mathmodeling comments? pic.twitter.com/oXFsBTNFRp
— Bharath Ananthasubramaniam (@bharath_ananth) March 30, 2020
I had written that Denmark too had a high rate of growth. But I subsequently realized the growth in Denmark (Figure 1) was composite with two different rates of growth and hence my original estimate was flawed. Interestingly, a fellow scandinavian country, Sweden, has a comparably low rate of growth (~5 days) with an honor system on social distancing.
Although this is not the right approach to answer this question, this data points to no significant stabilization in growth rates in Italy and Spain.
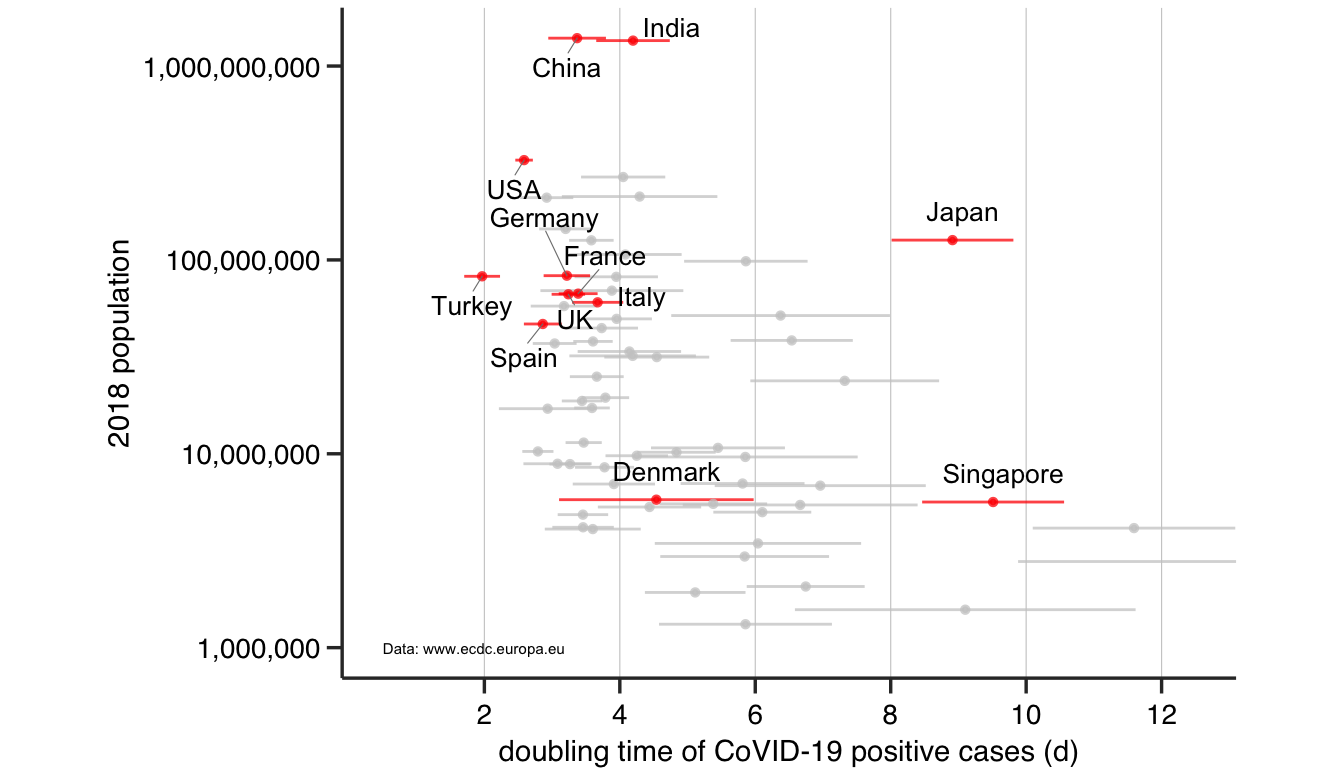
Figure 1: The doubling time (mean ± sd) in days of the number of infected individuals in countries of different population sizes.
One can look up the numbers for one’s favorite country below.
| Country | Doubling time (d) | SE of Doubling time (d) |
|---|---|---|
| China | 3.37 | 0.43 |
| India | 4.21 | 0.51 |
| USA | 2.63 | 0.14 |
| Indonesia | 4.17 | 0.63 |
| Pakistan | 4.49 | 1.18 |
| Brazil | 3.05 | 0.42 |
| Russia | 3.24 | 0.37 |
| Japan | 9.01 | 0.90 |
| Mexico | 3.74 | 0.37 |
| Philippines | 3.78 | 0.72 |
| Egypt | 6.08 | 0.94 |
| Germany | 3.29 | 0.35 |
| Turkey | 2.03 | 0.26 |
| Iran | 4.01 | 0.62 |
| Thailand | 3.89 | 0.99 |
| France | 3.44 | 0.29 |
| UK | 3.29 | 0.25 |
| Italy | 3.75 | 0.42 |
| South_Africa | 3.41 | 0.58 |
| South_Korea | 6.52 | 1.65 |
| Colombia | 4.04 | 0.51 |
| Spain | 2.93 | 0.29 |
| Argentina | 3.77 | 0.50 |
| Iraq | 6.40 | 0.82 |
| Poland | 3.72 | 0.31 |
| Canada | 3.08 | 0.32 |
| Saudi_Arabia | 4.14 | 0.71 |
| Peru | 4.30 | 0.91 |
| Malaysia | 4.68 | 0.79 |
| Australia | 3.74 | 0.40 |
| Taiwan | 7.99 | 1.68 |
| Romania | 3.89 | 0.36 |
| Chile | 3.52 | 0.30 |
| Netherlands | 3.68 | 0.28 |
| Ecuador | 3.14 | 0.79 |
| Belgium | 3.54 | 0.28 |
| Greece | 5.65 | 1.02 |
| Dominican_Republic | 2.99 | 0.63 |
| Czech_Republic | 3.83 | 0.46 |
| Portugal | 2.91 | 0.27 |
| Sweden | 4.92 | 0.58 |
| Hungary | 4.72 | 0.73 |
| United_Arab_Emirates | 5.34 | 1.35 |
| Israel | 3.23 | 0.54 |
| Austria | 3.35 | 0.32 |
| Switzerland | 3.87 | 0.45 |
| Bulgaria | 6.20 | 1.03 |
| Serbia | 4.30 | 0.79 |
| Lebanon | 7.39 | 1.69 |
| Denmark | 4.65 | 1.44 |
| Singapore | 9.84 | 1.14 |
| Finland | 5.51 | 0.80 |
| Slovakia | 7.27 | 2.00 |
| Norway | 4.59 | 0.80 |
| Costa_Rica | 6.47 | 0.82 |
| Ireland | 3.56 | 0.39 |
| Panama | 3.63 | 0.49 |
| Kuwait | 11.81 | 1.47 |
| Croatia | 3.76 | 0.72 |
| Uruguay | 6.49 | 1.65 |
| Armenia | 5.80 | 1.12 |
| Lithuania | 4.08 | 0.78 |
| Qatar | 12.83 | 3.05 |
| Slovenia | 6.98 | 0.91 |
| Latvia | 5.68 | 1.04 |
| Bahrain | 9.37 | 2.55 |
| Estonia | 6.07 | 1.30 |