I was recently comparing different likely models (each was a different time profile) for each gene in time-series RNA-seq data. Since I did not have simple nested models, I was forced to use (as the simplest option) the Akaike Information Criterion (AIC) (I could have used the Bayesian Information Criterion as well) to select the “best” model. In the analysis of genomic data, the next step is typically thresholding the corrected p-values (i.e., after correcting for multiple testing) to identify genes with statiscally significant fits to the model(s).
Of course, AIC does not provide an overall quality of fit for a gene, such as p-value, but rather AIC computes only a relative measure of the quality of fit of the models for a single gene. Since I was comparing simple linear models, I could obtain p-values for each model fit using the standard F-test. The question then arises, since model selection involves multiple fits (i.e., tests), should the p-value (from the best model) for the individual gene already be multiple-testing corrected ?
We are now going to use my standard trick to test if multiple testing is needed. It goes as follows: If the approach is applied to random data under the null distribution \[H_0\], then final p-values produced by the approach must continue to be uniformly distributed. If the distribution is either conservative or anti-conservative, then the approach is not statistically sound/consistent.
We generate a random dataset of 10^{4} genes each measured at 10 different points (one time unit part). We then apply three different time profiles for each gene: a linear trend, a quadratic profile or a sinusoidal profile of period ten time units.
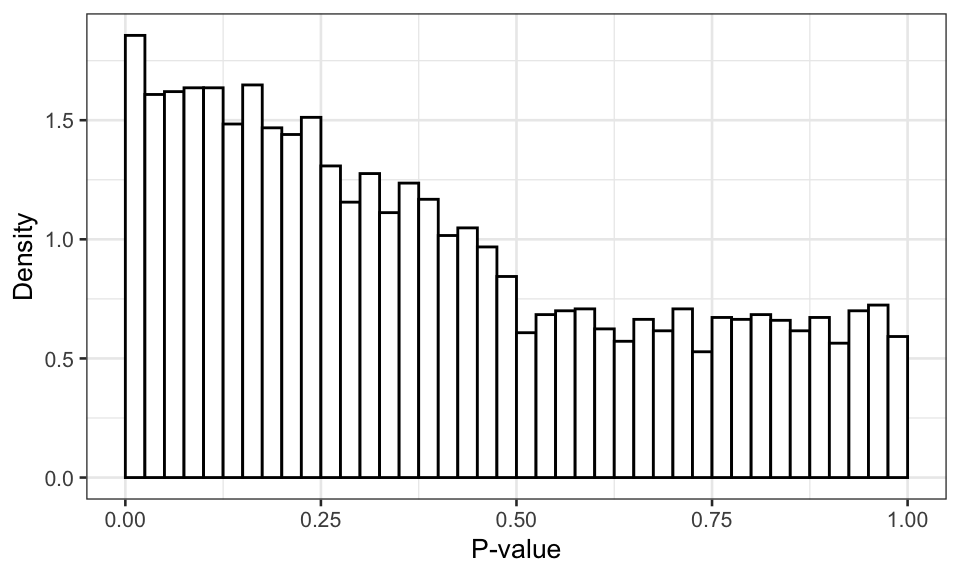
Figure 1: Distribution of the p-value of the best model without multiple testing correction.
As we see above, the p-value distribution is non-uniform and anti-conservative. In other words, the p-values will produce more false positives than expected under \(H_0\).
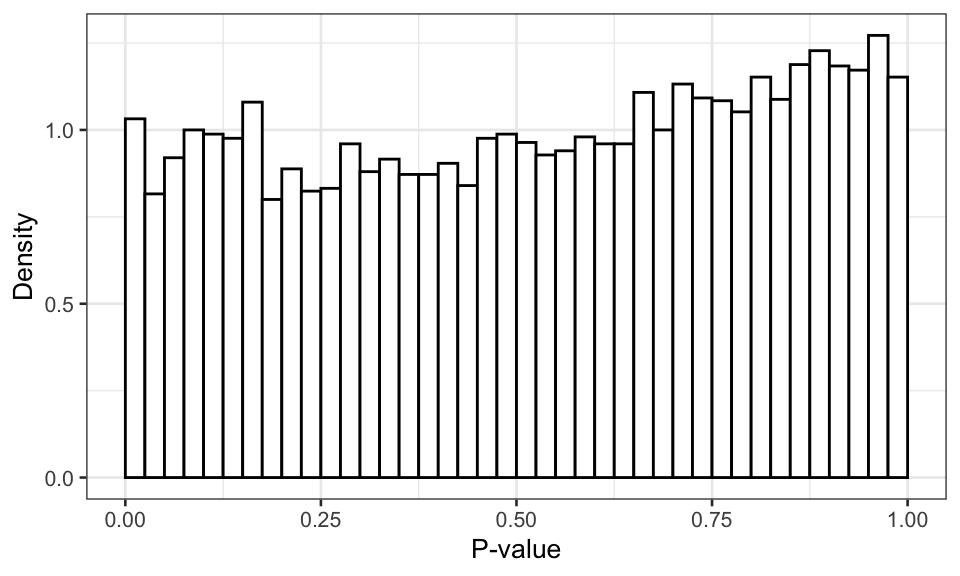
(#fig:corrected pvalues)Distribution of the p-value of the best model with multiple testing correction.
So, we inspect the p-values after multiple-testing correction for each gene using Benjamini-Hochberg. Clearly, the p-value distribution is indeed almost uniform as it should be under \(H_0\), although the distribution is a bit conservative (p-values biased away from small values). This suggests that the actual FDR using this model selection and correction approach will be smaller than suggested by theory, which is still okay.