Disclaimer: I am not an immunologist nor an epidemiologist. What I do know something about is time series analysis and modeling biological systems.
Background
In my previous post, I computed the doubling time of COVID-19 infections in different countries using a simple model. That model helped measure the current growth rate of the pandemic in different countries (more on what this really represents later), but did not make any predictions.
The spread of infection in the population is analogous to the growth of a tumour. Benjamin Gompertz proposed a simple model in 1825 for human mortality that has been successfully used to model tumour growth1. The idea behind the model is that at the start growth is exponential, when space is available and nutrients are plenty. However, as the tumour gets larger it gets limited by space and nutrients and its growth rate slows.
The spread of infection can also be viewed through the same lens. Initially, when the virus is allowed to spread unhindered the growth rate is rapid, but with the introduction of lockdowns and social-distancing, the rate slows and is finally also limited by the availability of new individuals to infect.
Method
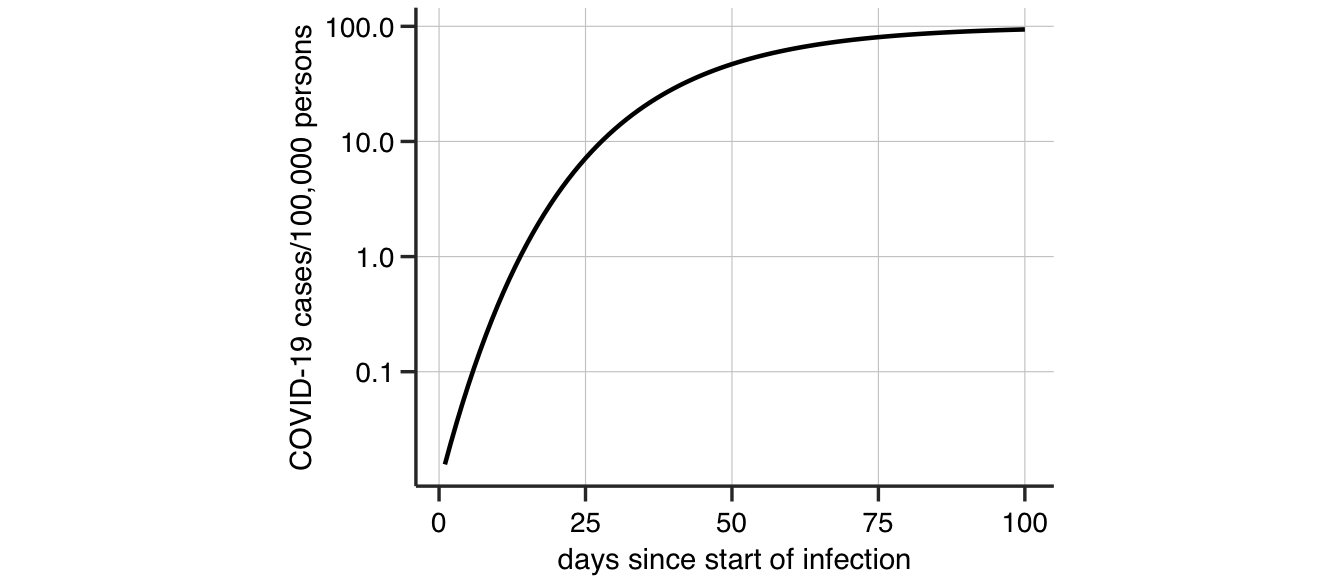
Gompertz growth in the number of infected individuals \(N(t)\) at time \(t\) is described by the equation \[ \frac{dN}{dt} = a \exp{(-bt)} N. \] The solution to the this equation is \[ N(t) = N_i~\exp\left( \log\left(\frac{N_f}{N_i}\right) (1 - \exp(-bt)) \right), \] where \(N_i\) is the initial infected population, \(b\) is the infection growth rate at the start and \(N_f\) is the final infected population. Equivalently, this solution can be viewed in terms of the number of positive COVID-19 cases per 100000 persons (see Figure 1).

Figure 1: An example Gompertz growth curve
I fit this model to the data from the European Centre for Disease Prevention and Control to estimate \(N_f\), the final number of infected individuals, and rate \(b\) in different countries. This fitting is done using stats package in R using nls() and SSgompertz().
Results
The growth in the COVID-19 positive cases is a consequence of both the spread of infection and increased identification of infection in individuals through increased testing. There is currently no easy way to differentiate the contribution of these two factors. Morever, the limitations in testing and data reporting make accurate modeling of the true dynamics of the infection well-nigh impossible 2 3. Invoking Occam’s Razor and using very simple models (something I advocate a lot in my own research) like Gompertz growth to obtain some insights therefore makes a lot of sense.

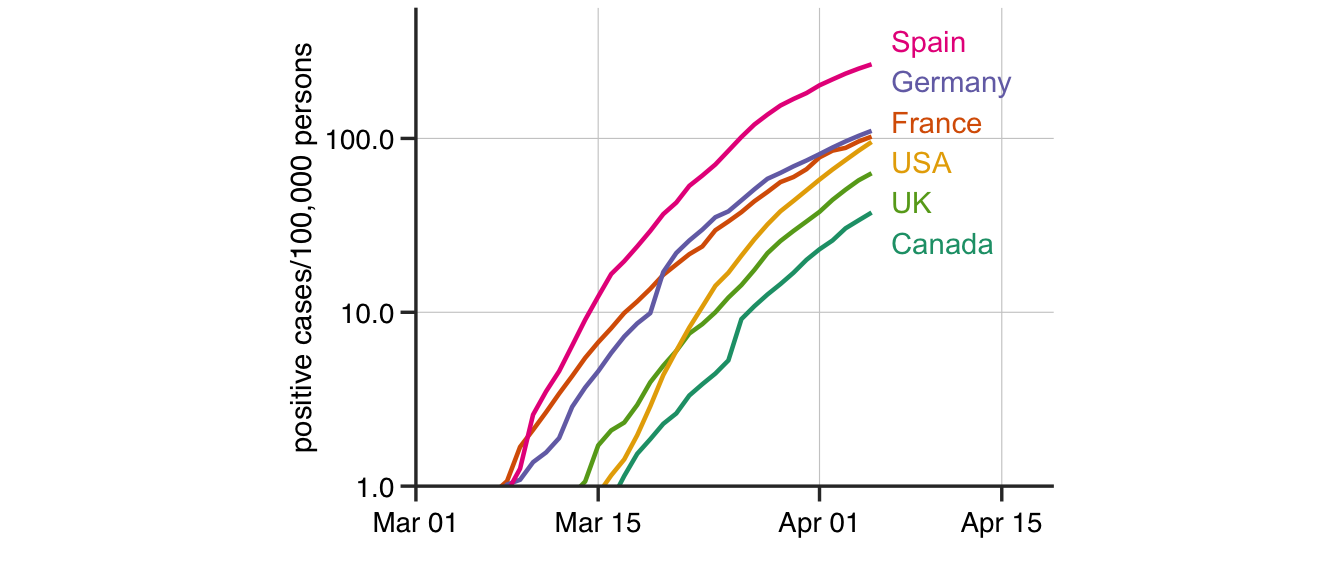
Figure 2: The number of positive COVID-19 cases in six developed countries plotted per 100000 inhabitants
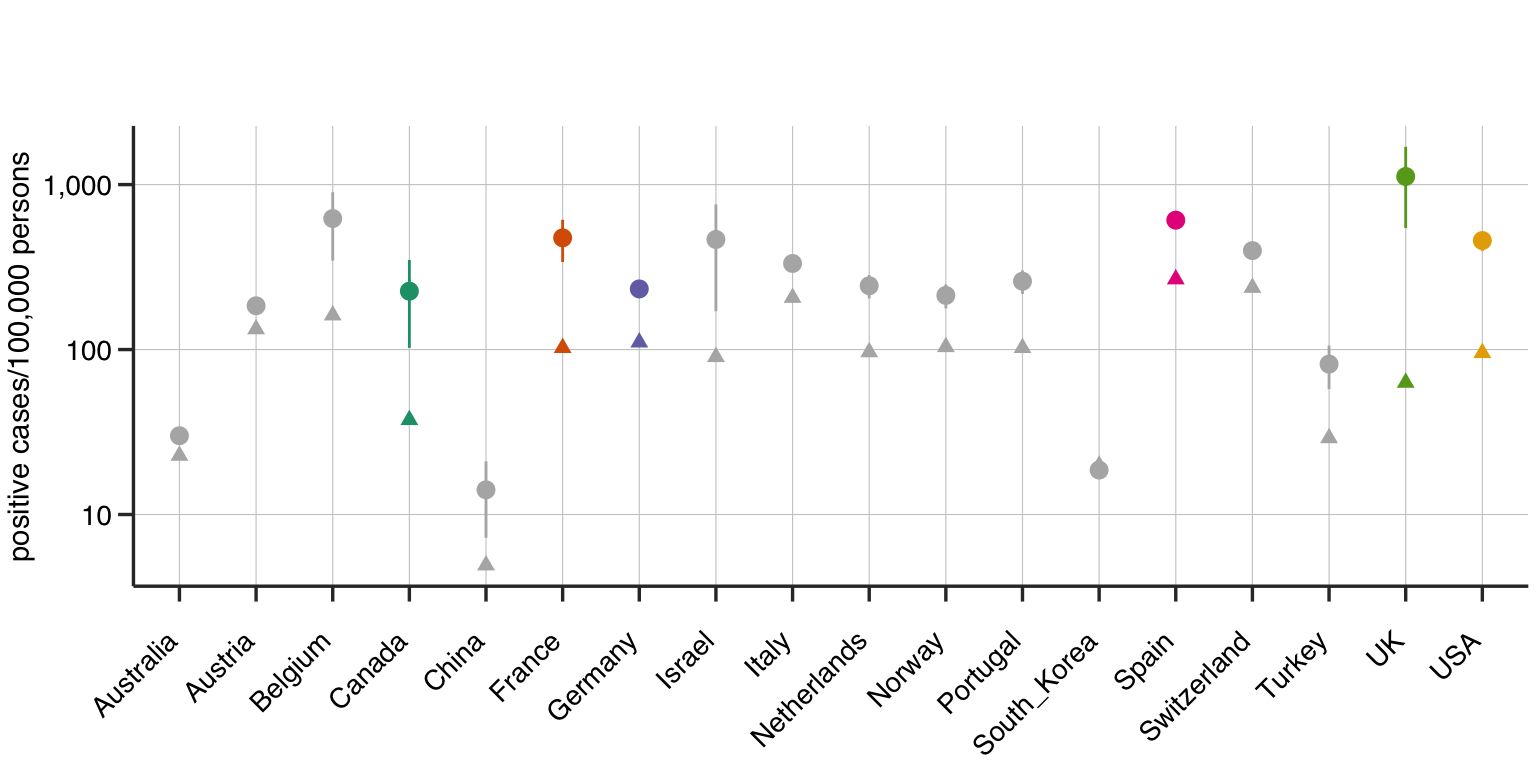
Assuming that the current trends in the data continue, one can extrapolate the (asymptotic) leveling-off point in the number of infections using the Gompertz growth model. At the leveling-off point, there is no further new infections reported. The number of COVID-19 infections plotted per 100,000 persons is remarkably consistent in Spain, Germany, France, USA, United Kingdom and Canada (Figure 2). Even expanding to all countries with at least 5000 infected persons, the infections plateau at about 100-1000 infected cases/100,000 person or a COVID-19 incidence of 0.1-1% in the population (Figure 3).

Figure 3: The number of infections/100,000 persons with the 95% confidence in the estimate extrapolated using the Gompertz model. The current state of the pandemic is that country is marked with a triangle. The color coding is matched to Figure 2.
The time remaining to reach the plateau might be inferred from the distance between the current state of the epidemic in the country (triangle) and the estimated plateau of the infection (circle) (Figure 3). Accordingly, Australia and South Korea are predicted to have conquered the epidemic, while UK and Canada have the most time remaining to reach stability with the USA a little behind them. However, the model lets us make better predictions.
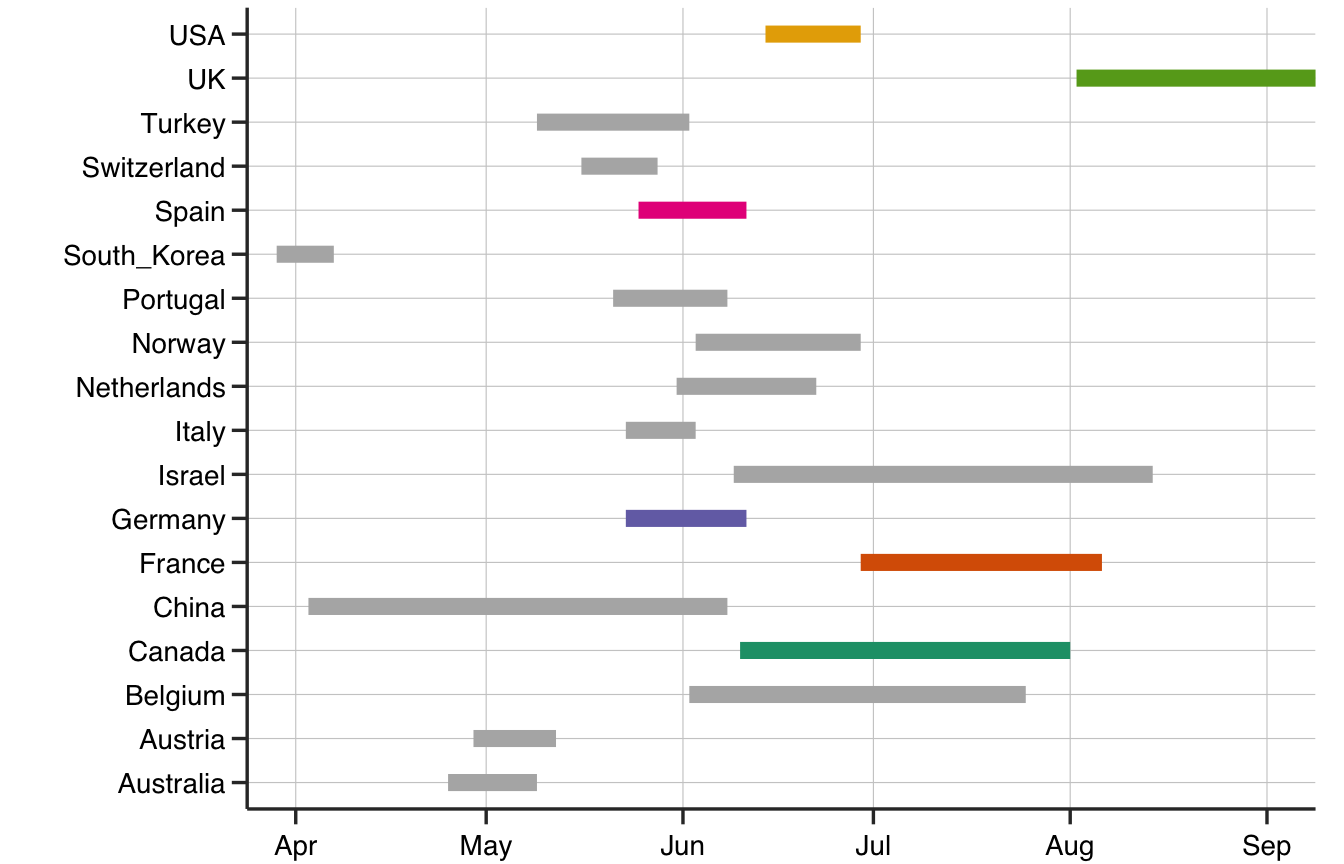
Figure 4 shows the range of times to achieving 99% of the plateau in infections in different countries that are consistent with data until April 6th 2020. As we suspected earlier, the United Kingdom, France and Canada are expected to achieve stability in the number of infections only well into the summer. Spain, Germany and Italy should be clear by the beginning of June and the USA is predicted to be out of the woods by mid-June. The country that is expected to suffer the most is Iran with infections stabilizing only in October (omitted for clarity). In summary, the model predicts at least another 2 months before infections really stabilize in most of Europe and North America.

Figure 4: Date Ranges in 2020 (with 95% confidence) when a plateau of infections is likely to be achieved in different countries as predicted by the Gompertz model. Iran’s values were beyond the chosen scale.
Laird, A. Dynamics of Tumor Growth. Br J Cancer 18, 490–502 (1964). https://doi.org/10.1038/bjc.1964.55↩︎
Why It’s So Freaking Hard To Make A Good COVID-19 Model, FiveThirtyEight.com. https://fivethirtyeight.com/features/why-its-so-freaking-hard-to-make-a-good-covid-19-model↩︎
Die Zahlen sind vollkommen unzuverlässig, Spiegel.de. https://www.spiegel.de/wissenschaft/medizin/coronavirus-die-zahlen-sind-vollkommen-unzuverlaessig-a-7535b78f-ad68-4fa9-9533-06a224cc9250↩︎